

Indicate Interest
Fill out the EOV interest form with some basic details about your property and management. The Savory EOV team will then put you in touch with an accredited EOV Verifier from a local Savory Hub.
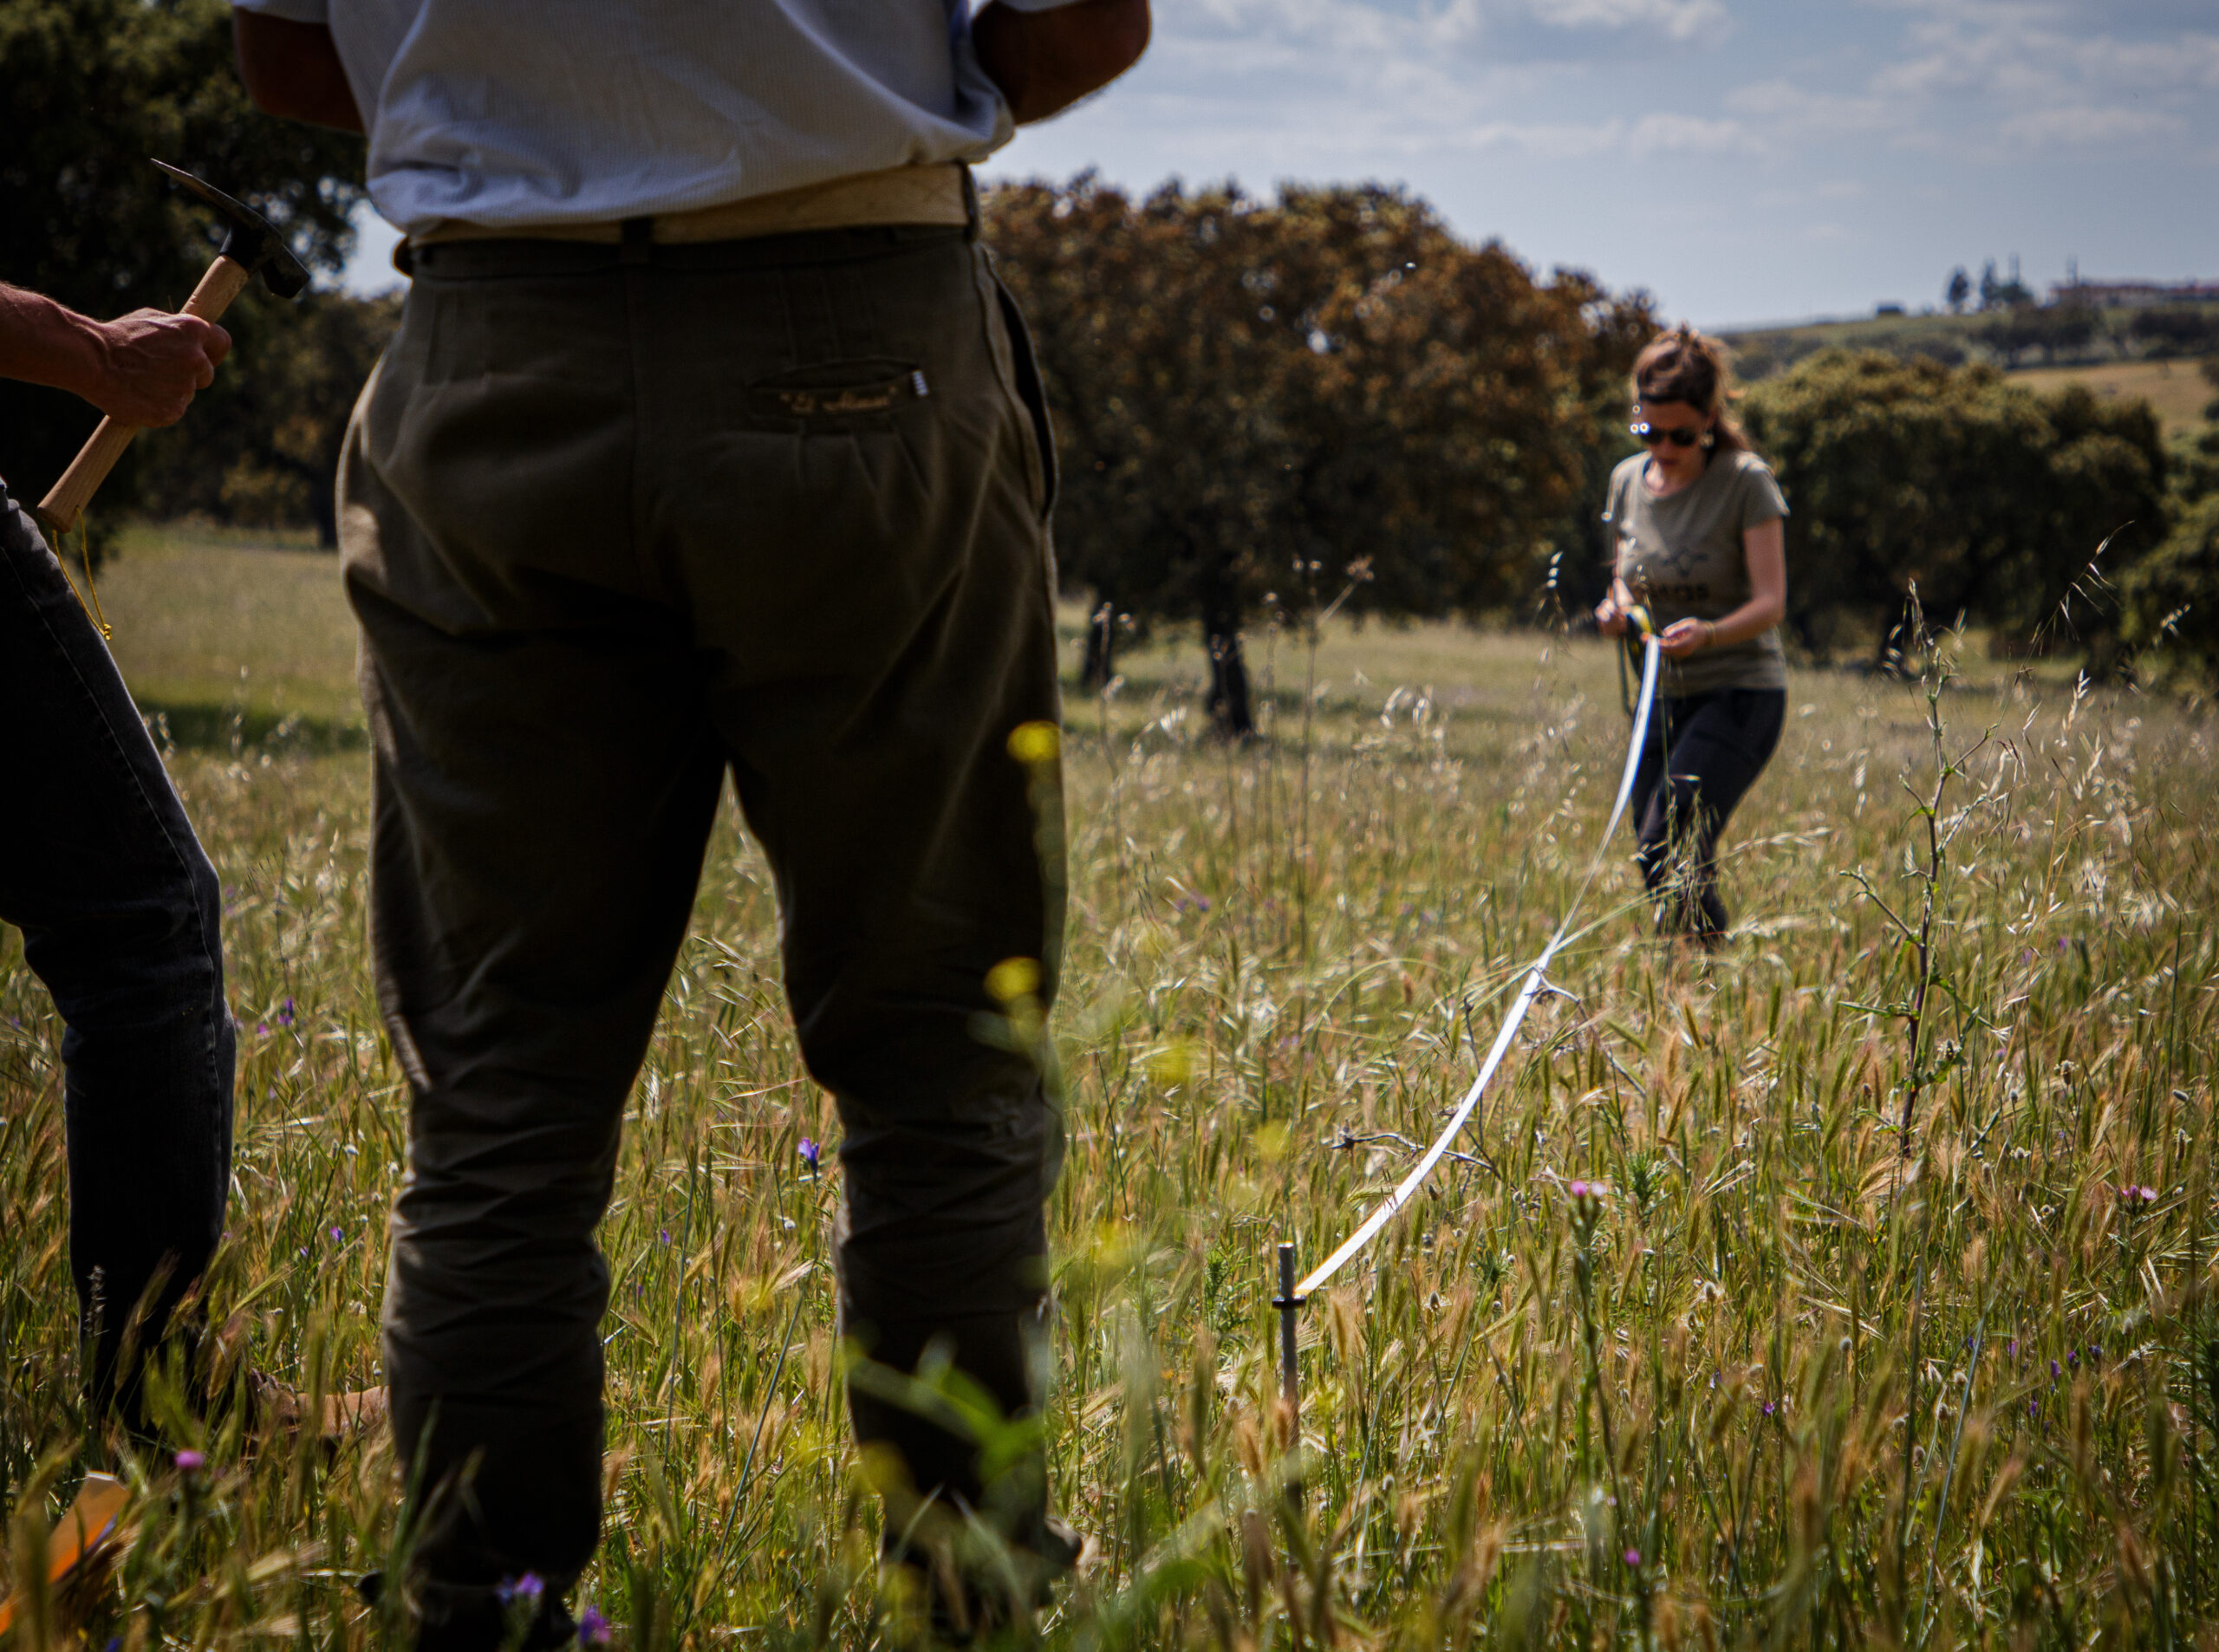
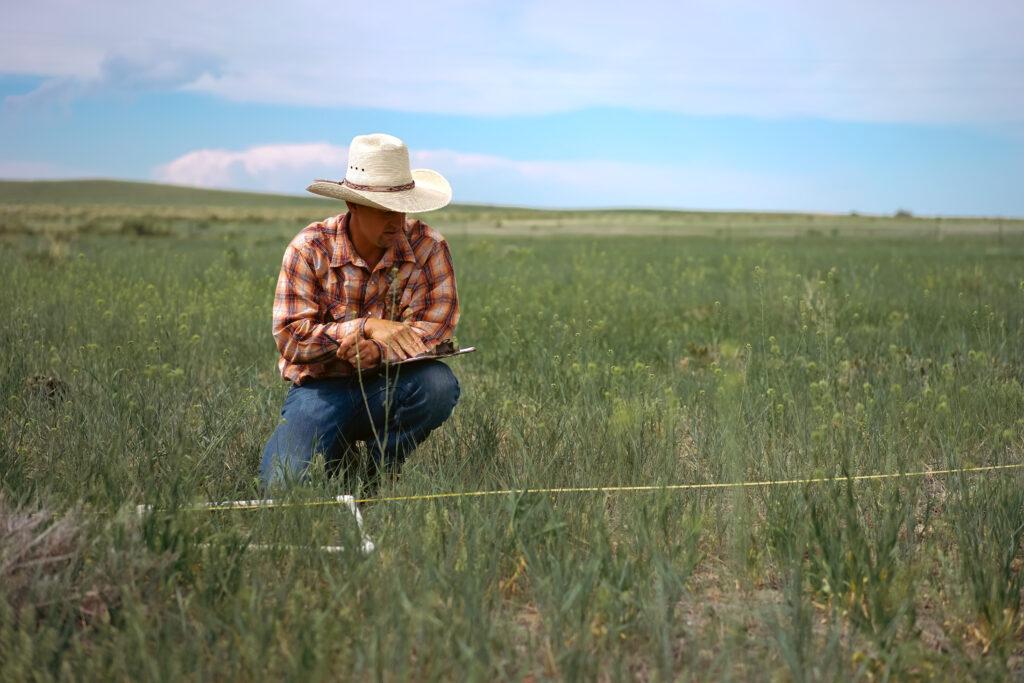
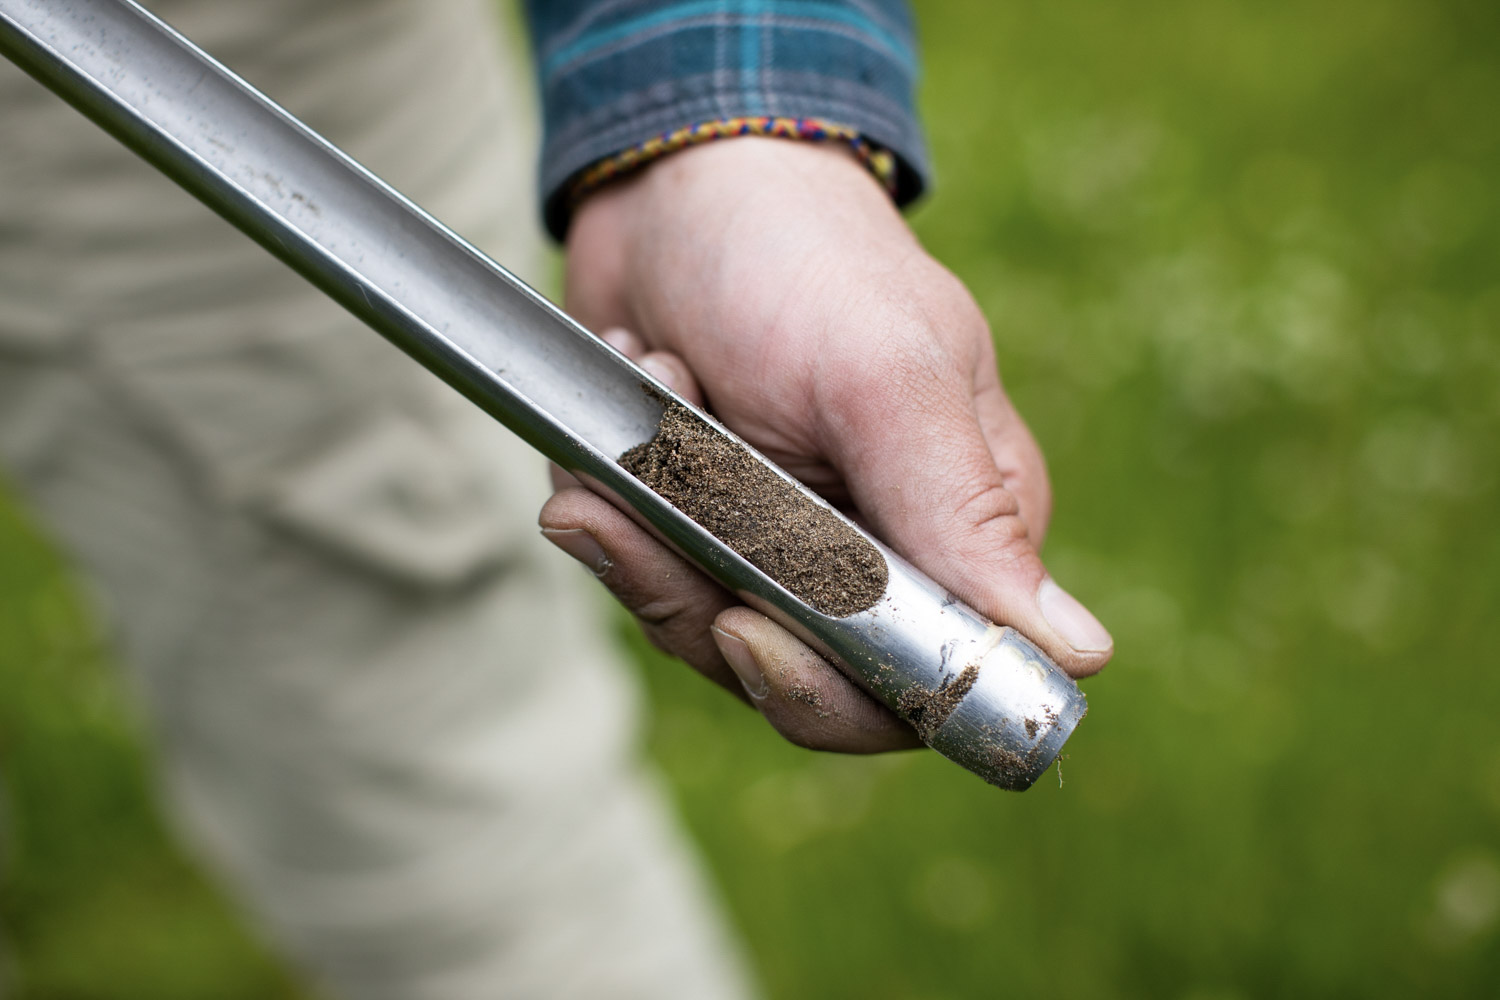
Establish Baseline
A regional EOV Verifier schedules a farm/ranch visit, prepares farm mapping, and creates a short-term monitoring (STM) plan. Using STM data, the verifier finalizes the farm monitoring plan by locating where to establish long-term monitoring (LTM) sites. LTM data is then collected along with soil samples, and the combination of STM and LTM data provides a baseline measurement.
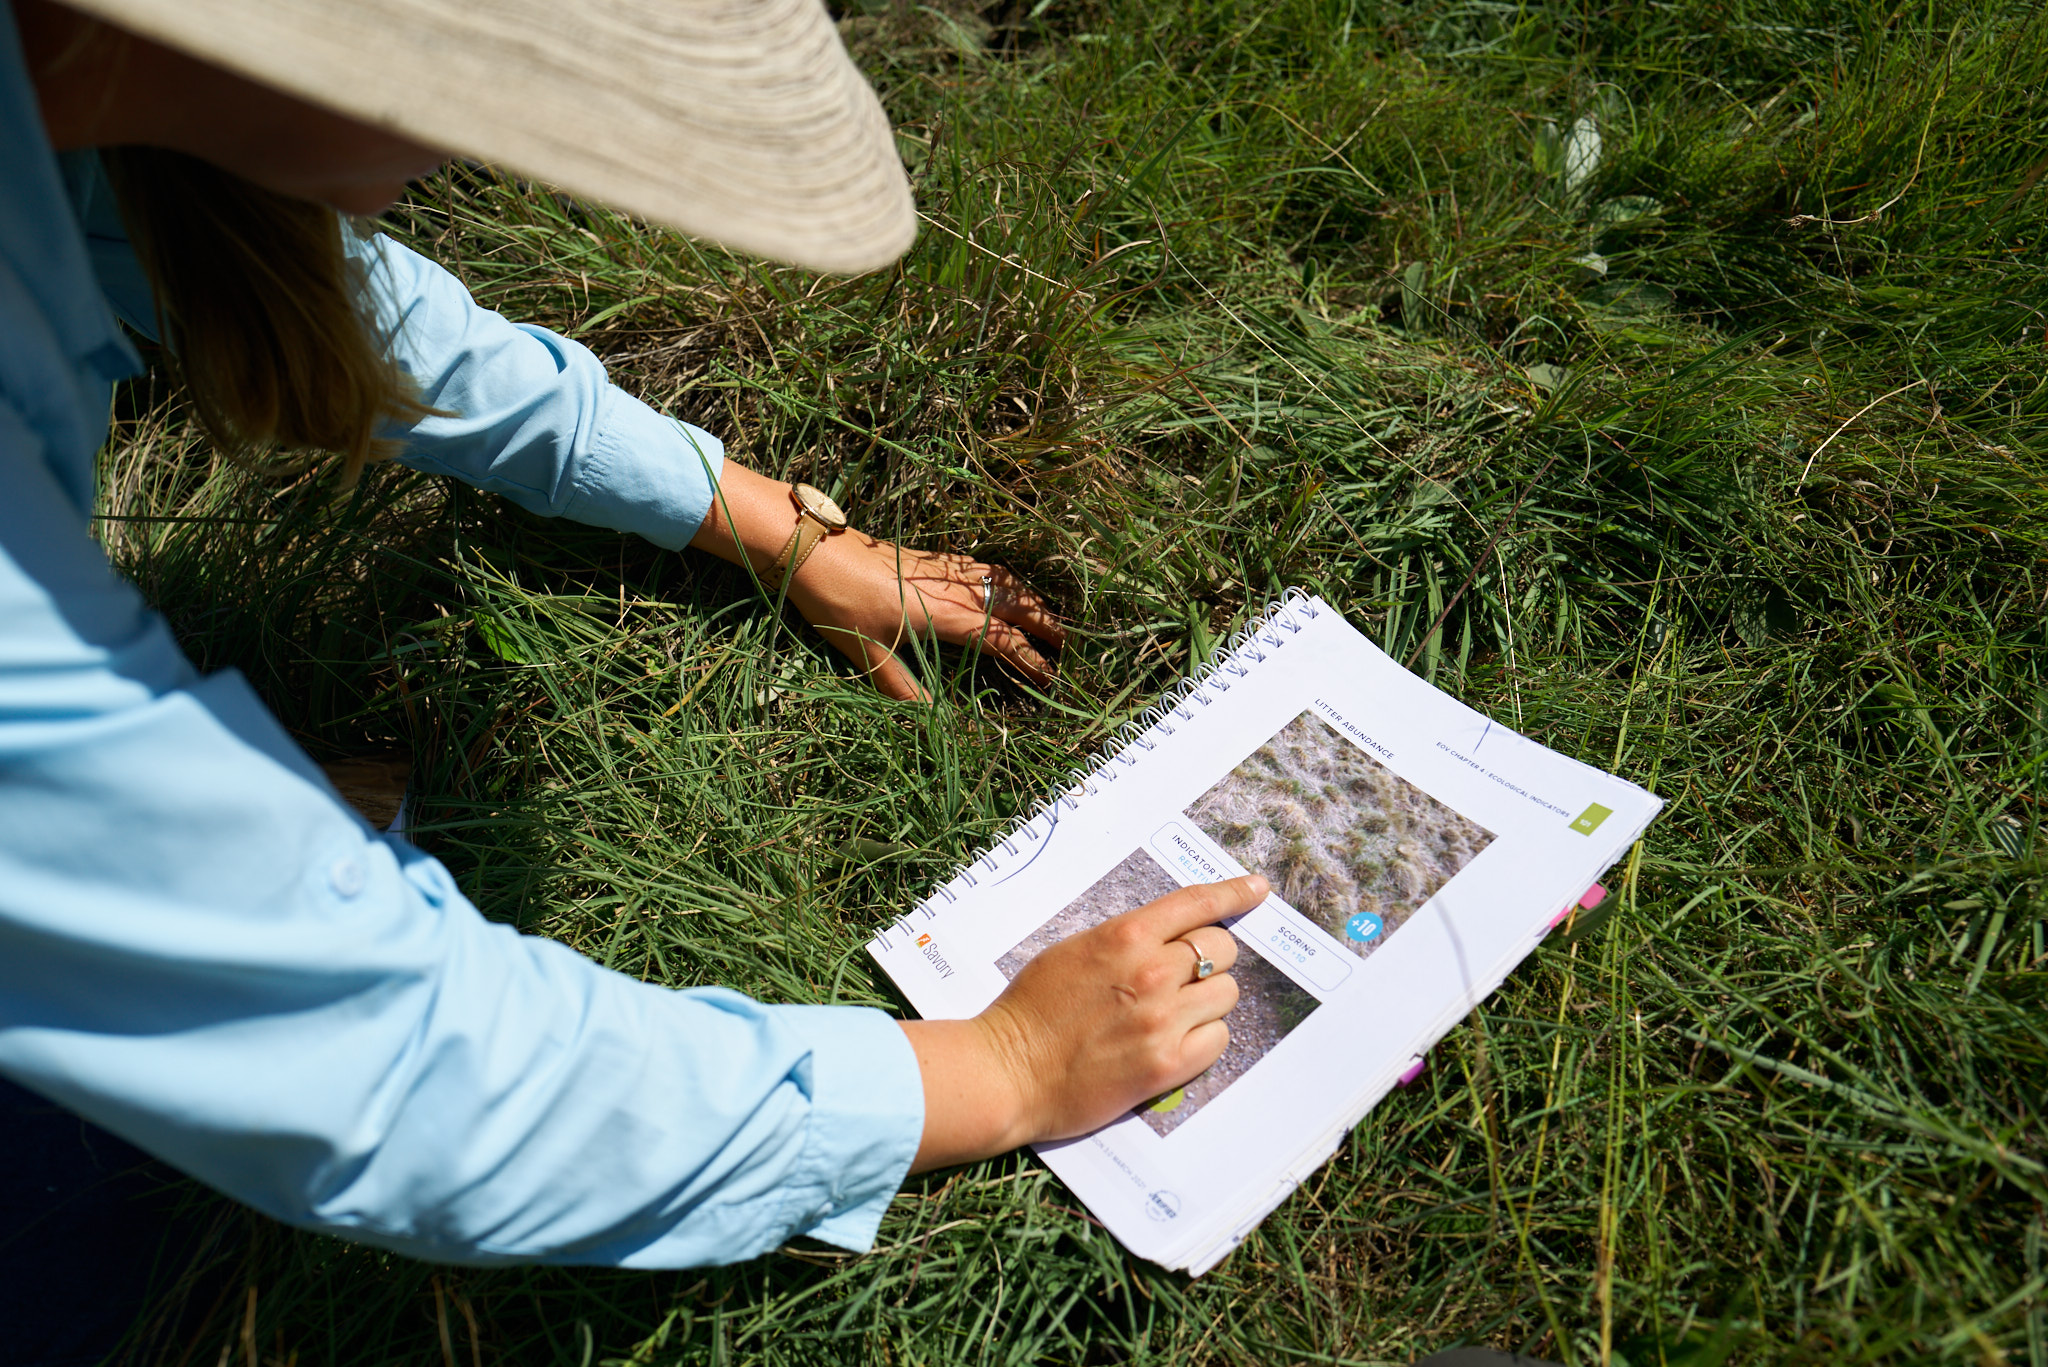
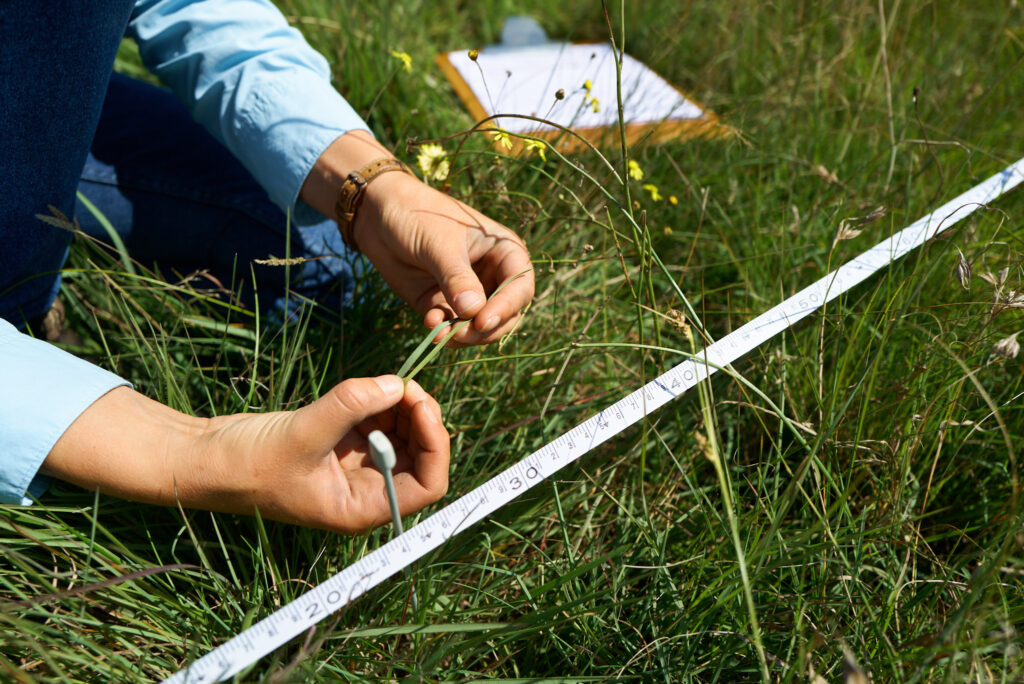
Annual Monitoring
An accredited EOV Monitor visits to conduct the annual short-term monitoring. If results indicate regeneration in the context of the ecoregion, EOV verification is granted/renewed by the EOV Global Quality Assurance (QA) team and the landbase is then eligible to apply for Land to Market product verification.
Every 5 Years
On a five-year interval, an accredited EOV Monitor returns to the farm to conduct both short-term and long-term monitoring. If data confirms land regeneration, verification is renewed.